
How to Read the Protein Percentage on Wheat Flour
Read protein per 100 g, compare three flours with the same amount of water and choose a flour for bread, cake or cookies.

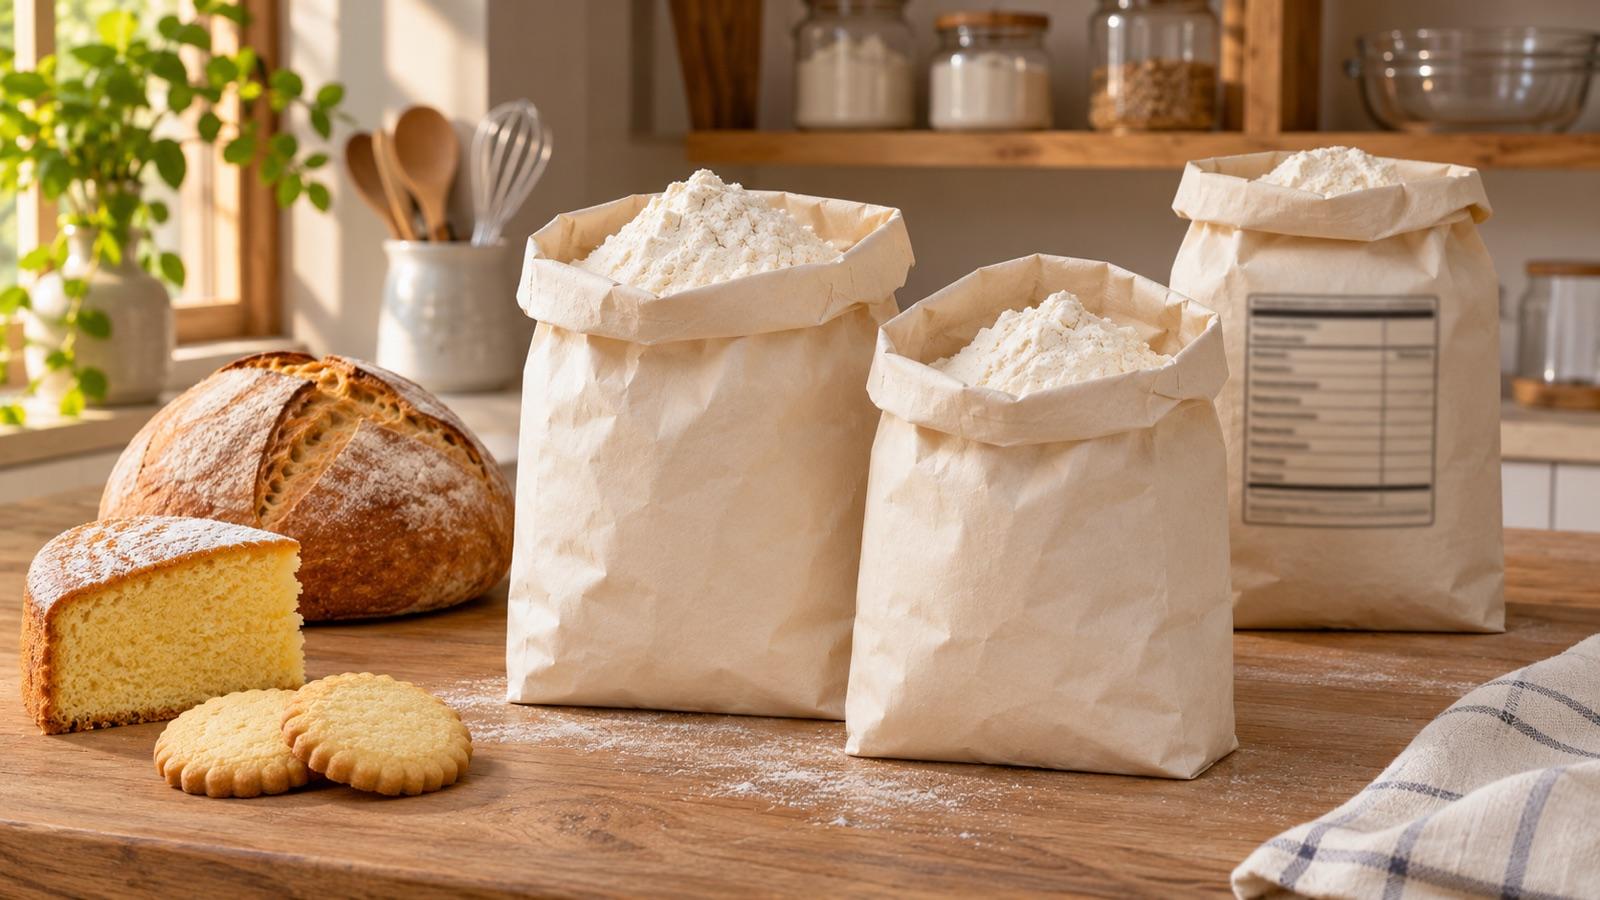
Find protein per 100 g in the nutrition table on your flour bag. A value of 12 g is about 12% by weight. Among similar white flours, higher protein generally means more potential to form a strong gluten network. That can help in bread. For a tender cake or a crumbly cookie, a lower-protein flour specified by the recipe is a good place to start. Flour type, water and mixing also affect the result.
Compare the same weight of flour
Compare the grams of protein in the “per 100 g” column. If the label gives protein per serving only, divide the protein weight by the serving weight and multiply by 100. For example, 4 g in a 30 g serving gives about 13.3%. Serving figures may be rounded. If two products are close, check the manufacturer’s more detailed specification. The percentage of daily reference intake answers a separate nutrition question.
King Arthur Baking reports 10% for its cake flour, 11.7% for all-purpose and 12.7% for bread flour. These are three products in one range. Another mill can use the same names for flours with different values. Use the front of the bag as a guide to intended use and the back for the comparison. Read the ingredients too. A cake mix with leavening may behave differently from plain cake flour at a similar protein percentage.
King Arthur Baking · Protein percentage in flour
Try three flours with equal water
Choose three similar white flours and label a bowl with each name and protein value. Weigh 40 g flour and 24 g room-temperature water into each bowl. That makes 60% water by flour weight. Mix each for 30 seconds using the same spoon and motion. Cover and rest for 15 minutes. Before adding water or flour, look for dry pockets, an evenly joined mass or a very sticky surface.
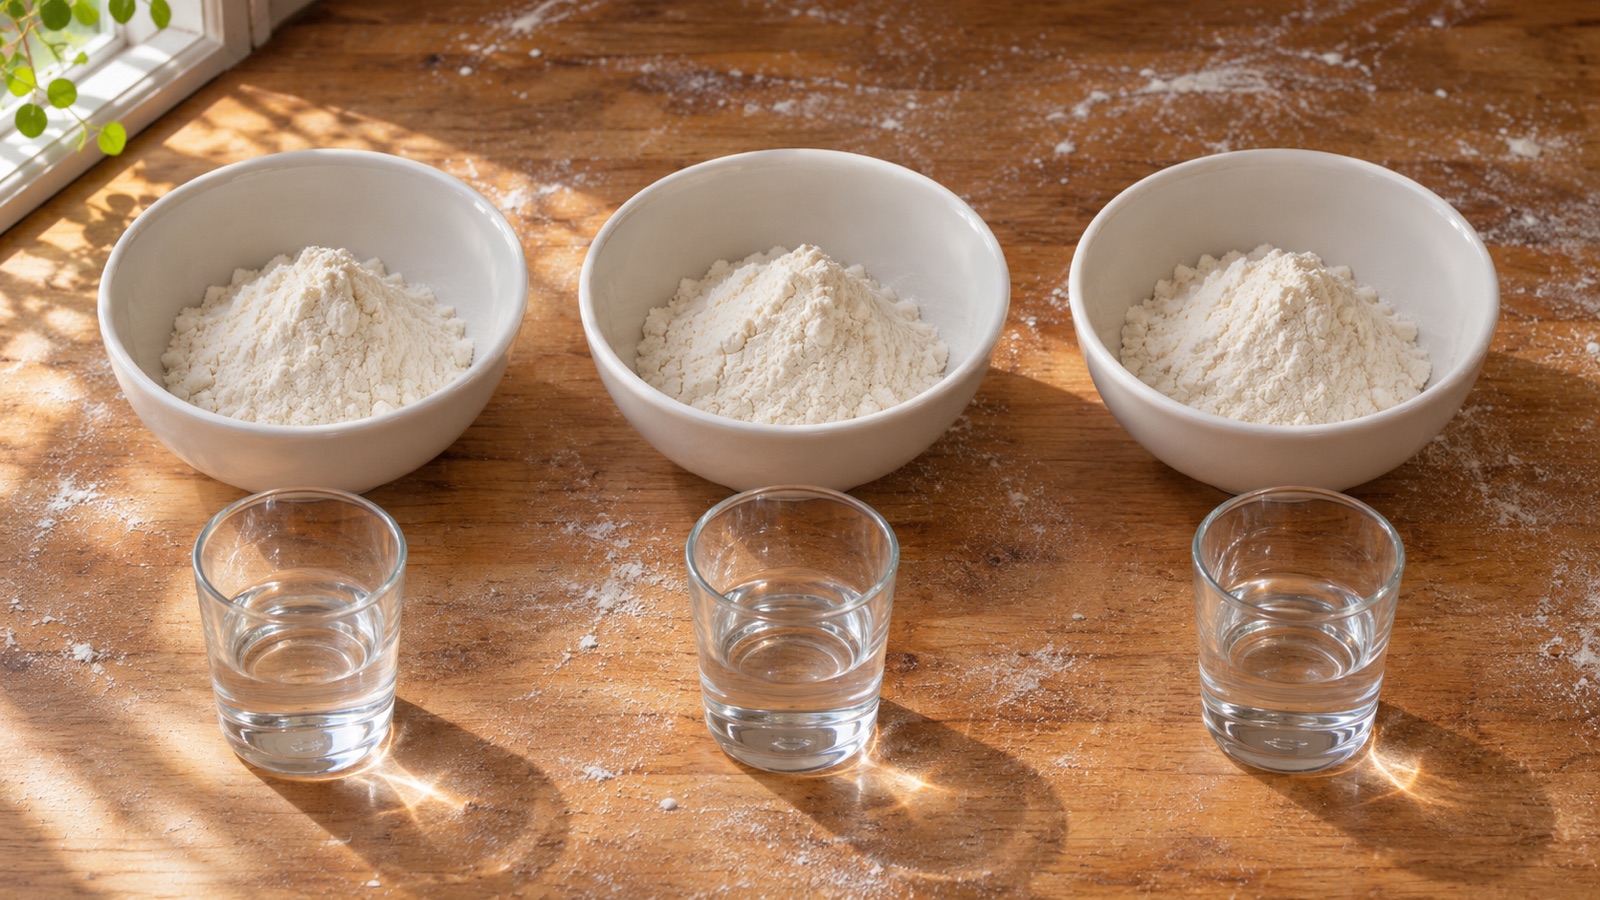
Gently stretch equal-sized pieces. Note which stretches farther before breaking and which tears sooner. Equal water and rest time make the differences easier to see. The test gives no optimum bread formula or measurement of gluten strength, and milling and protein composition affect the observation. The FDA advises against tasting raw flour and dough. Discard the samples without tasting and wash your hands, bowls, spoon and worktop with soapy water.
USDA ARS · Relationship of Bread Quality to Kernel, Flour, and Dough Properties · FDA · Handling Flour Safely
Starting points for bread, cake and cookies
A yeasted loaf needs dough that holds gas and stays together when shaped. If the recipe asks for bread flour, start with a comparable higher-protein white flour. When switching flour in a familiar formula with 300 g flour and 195 g water, hold back 10 g water. Give the first mix a short rest and add the reserved water in small amounts if dry patches remain. If it feels sticky, finish the recipe’s rests and folds before reaching for extra flour.
For a soft, fine-crumb plain cake, use the specified cake flour and mix only until the dry flour is moistened. If you try all-purpose flour, keep the remaining quantities fixed and compare the cooled cakes. For crumbly butter cookies, start with the plain lower-protein or all-purpose flour specified. If the raw dough looks soft, follow the chilling step and bake a small test batch before adding flour. Butter temperature and sugar can also change cookie spread.
What does the same number mean in whole wheat and white flour?
Nutrition tables give total protein, including proteins that do and do not contribute to the gluten network. Two white flours with the same percentage can behave differently because wheat variety and protein composition vary. Whole wheat also contains bran and germ, which change how the dough takes up water and stretches. Li and colleagues found a strong relationship between the protein figures for paired white and whole wheat flours. The properties associated with loaf volume showed less agreement.
For a small trial in a white bread recipe using 200 g flour, replace 50 g white flour with 50 g whole wheat. Start near the original water amount and add a little at a time if the rested dough is still stiff and ragged. Record the final water weight and the crumb of the baked bread. For a loaf with mostly whole wheat, use a recipe designed for it so the initial water and rest suit the flour.
Li et al. · Comparing white and whole wheat flours
When a bake turns out differently than expected
If a loaf comes out flat, note how the dough behaved when shaped and how it rose during proofing. Stickiness alone tells you little about flour strength. In the next batch, change one factor such as flour or water and keep the rest of the method fixed. That makes it easier to trace a difference to the new flour or the way you handled it.
For a tough cake, check whether you weighed the flour and how long you mixed after adding it. If cookies spread too far, check the temperature of the dough and the tray. Put the percentage on the bag and record the result by the recipe. Next time you shop, find flours designed for the bake and compare protein between similar products. You will have a kitchen observation to go with the number on the bag.
İyi Bir Yemek
Food Researcher & Writer
Reader Comments & Contributions
Be the first to share your thoughts on this post